Galaxy DNA-Seq Tutorial: Difference between revisions
| (36 intermediate revisions by 2 users not shown) | |||
| Line 1: | Line 1: | ||
= Galaxy DNA-Seq Tutorial = | = Galaxy DNA-Seq Tutorial = | ||
Presentation [[media:RCD2011_DNA-Seq_Workshop_Talk.pdf|PDF]] or original [ftp://ftp.genome.uab.edu/ICS/Galaxy_RNAseq_tutorial/RCD2011%20DNA-Seq%20Workshop%20Talk.pptx PPTX] from HPC Boot Camp 2011. | |||
== Linking to data == | == Linking to data == | ||
| Line 6: | Line 9: | ||
* Select "Shared Data" from the top of the screen to bring up the Shared Data screen | * Select "Shared Data" from the top of the screen to bring up the Shared Data screen | ||
* Select Data Library | * Select Data Library | ||
* Select " | * Select "Galaxy DNA-Seq Tutorial Vaccinia WR Files" from the alphabetically sorted list | ||
[[File: | [[File:GalaxyTutorialSharedLibrary.jpg]] | ||
| Line 19: | Line 22: | ||
* Notice that with just 3 viruses are already over 4 GB of data! | * Notice that with just 3 viruses are already over 4 GB of data! | ||
== Metadata - Formatting and Grooming Data == | |||
== Formatting and Grooming Data == | * Your data is often NOT what you expect so it is worth running some quality control programs | ||
* Your data is often NOT what you expect | |||
=== FastQ Format === | === FastQ Format === | ||
| Line 31: | Line 33: | ||
* In Galaxy the expected data type of the galaxy tool must match EXACTLY with the data type in your history pane, otherwise the option to use that particular piece of data will not appear in the tool's drop down menu for data selection. | * In Galaxy the expected data type of the galaxy tool must match EXACTLY with the data type in your history pane, otherwise the option to use that particular piece of data will not appear in the tool's drop down menu for data selection. | ||
* Some tools care more than others... | |||
* Galaxy requires that everything go into Sanger format to be used. If you know your data is in sanger format, select fastqsanger for your data type. If it is not in that format, select fastq and run the FastQ Groomer. | * Galaxy requires that everything go into Sanger format to be used. If you know your data is in sanger format, select fastqsanger for your data type. If it is not in that format, select fastq and run the FastQ Groomer. | ||
* FastQ groomer is very useful, but slow | * FastQ groomer is very useful, but slow | ||
* Not a bad idea to run it if you are dealing with a new machine and have the time. Costly in terms of space. | * Not a bad idea to run it if you are dealing with a new machine and have the time. Costly in terms of space. | ||
* All files for the workshop have been pre-groomed so you don't need to do any grooming. | |||
=== Reference Genome === | === Reference Genome === | ||
* Ensure the correct reference genome is selected | * Ensure the correct reference genome is selected. WARNING - seeing the reference genome doesn't mean it is there for using - the current list of genomes available at UAB is [http://docs.uabgrid.uab.edu/wiki/Galaxy#Available_datasets here] | ||
* Contact the UAB Galaxy team or me (ozborn@uab.edu) if you need a genome added | |||
* The reference genome is used for a variety of tools, some tools care more than others. | |||
* Contact the UAB Galaxy team or me if you need a genome added | Notice any problems with CMV-21950R_3_1.fastq ? The meta-data is wrong, fix it before proceeding. | ||
* | |||
== Assessing the quality of the data == | == Assessing the quality of the data == | ||
| Line 54: | Line 56: | ||
* Select NGS: QC and manipulation -> FastQC | * Select NGS: QC and manipulation -> FastQC | ||
[[File:FastQCRunSettings.jpg]] | [[File:FastQCRunSettings.jpg]] | ||
* Run it on all the fastq files | * Run it on all the 6 fastq files | ||
* Remember, you are on a cluster, this can be done in parallel | * Remember, you are on a cluster, this can be done in parallel! | ||
=== FastQC Results === | === FastQC Results === | ||
| Line 61: | Line 63: | ||
* FastQC flags potential problems | * FastQC flags potential problems | ||
* Are there any problems for us? | * Are there any problems for us? | ||
[[File:Fastqc summary.jpg]] | |||
* Remember earlier comments about poxvirus genome architecture.. | |||
The overall quality of the bases is excellent, but sometimes binning can hide some ugliness. | |||
[[File:CMV VAC WR 3 2 base quality.jpg]] | [[File:CMV VAC WR 3 2 base quality.jpg]] | ||
* | * Base quality looks good, but breakdown is not on a per base basis | ||
=== Running Quality Statistics and Boxplot === | === Running Quality Statistics and Boxplot === | ||
| Line 89: | Line 97: | ||
== Trimming Reads == | == Trimming Reads == | ||
* About a quarter of the last base is of poor quality | * About a quarter of the last base is of poor quality | ||
* Trim off the 3' end | * Trim off the 3' end off Cmv21950R_3_1 | ||
* Select NGS: QC and manipulation -> FASTQ Trimmer by column which is under Generic Fastq Manipulation | |||
[[File:FastQTrimmerRun.jpg]] | [[File:FastQTrimmerRun.jpg]] | ||
| Line 97: | Line 106: | ||
=== Results === | === Results === | ||
* Take the trimmed data and run again compute quality statistics and draw the boxplot | * Take the trimmed data and run again compute quality statistics and draw the boxplot as was done earlier | ||
[[File:Cmv21950r 3 1 trimmed boxplot.jpg]] | [[File:Cmv21950r 3 1 trimmed boxplot.jpg]] | ||
* Results should look like above if everything was done correctly | * Results should look like above if everything was done correctly | ||
* May want to rename your trimmed result file to something more useful like "Cmv21950r 3 1 trimmed" or something. Just click on the current name to rename the data. | |||
== Short read alignment to reference genome using BWA == | == Short read alignment to reference genome using BWA == | ||
* BWA will align all the short reads to our reference genome | |||
* BWA is the algorithm of choice for DNA-Seq with Illumina data | * BWA is the algorithm of choice for DNA-Seq with Illumina data | ||
* CASAVA 1.8 may do as well for SNPs, BWA does indels better | * CASAVA 1.8 may do as well for SNPs, BWA does indels better | ||
* Select NGS Mapping -> Map with BWA for Illumina | * Select NGS Mapping -> Map with BWA for Illumina | ||
* Set the reference genome as Vaccinia Western Reserve, BWA doesn't pick this up | |||
* Selected paired reads, make sure the first read (1) comes first | |||
[[File:Bwa run cmv 227r.jpg]] | [[File:Bwa run cmv 227r.jpg]] | ||
* Do this for all 3 genomes, each run will use 2 fastq files | |||
== Samtools == | |||
* Essential toolset, performs a variety of functions | |||
* Format conversion | |||
* Viewing BAM files | |||
* Flagstats | |||
* Generation of Pileup | |||
== BAM Conversion == | === BAM Conversion === | ||
* The output of many mapping programs (including BWA) is in SAM format and must in many cases be converted to the binary format (BAM) format for downstream analysis | * The output of many mapping programs (including BWA) is in SAM format and must in many cases be converted to the binary format (BAM) format for downstream analysis | ||
* The conversion is lossless. | * The conversion is lossless. | ||
* As a binary file, it is significantly smaller than the SAM file | * As a binary file, it is significantly smaller than the SAM file | ||
* Convert all 3 SAM files to BAM | |||
[[File:Sam2bam.jpg]] | [[File:Sam2bam.jpg]] | ||
== | * In this case we did not do any filtering on the SAM file prior to conversion to BAM | ||
* Often when quality is desired, a filtering step will be done to remove reads which: | |||
* Fail quality control | |||
* Are optical duplicates | |||
* Are not properly paired | |||
Additionally a sorting step may be done, important if you are going to examine the BAM file in a browser like IGV | |||
* See Shared Data -> Published Workflows -> "FastQ to High Quality, Filtered, Headered, Sorted BAM" or | |||
* Click on this [http://galaxy.uabgrid.uab.edu/u/ozborn/w/fastq-to-high-quality-filtered-headered-sorted-bam workflow] | |||
=== Flagstat === | |||
* Examines the flag integer in the BAM File | |||
[[File:SamBamFileFormatFlags.jpg]] | |||
[[File:Flagstat.jpg]] | |||
=== | === Generate Pileup === | ||
* | |||
* Should have 3 BAM files | |||
* Can think of the reads "piling up" on each other | |||
* Each base pair location on the genome is assigned a representative base | |||
* For each of the 3 BAM files, run NGS: SAM Tools -> Generate Pileup | |||
[[File:GeneratePileup.jpg]] | [[File:GeneratePileup.jpg]] | ||
You should get pileups with ~150kb of reads. Unfortunately, probably because the MAC consensus model was selected Galaxy assigns the output format as tabular instead of pileup. This will cause a problem when filtering the pileups, so alter the metadata of the 3 files to "pileup" from tabular. | |||
== SNPEff | === Alternatives to Samtools for Variant Detection === | ||
* GATK - Emerging as the new best practice to call variants, not integrated into Galaxy just yet. | |||
* PATRIC - Whole genome annnotation (once you have a sequence) for microbial genomes | |||
* MAQ and others - not used too much anymore | |||
If you are having trouble getting to this stage, don't worry, correct pileup files for all 3 viruses are in the same shared data library | |||
[[File:GalaxyTutorialSharedLibrary.jpg]] | |||
== SNP Effect (SNPEff) - Variation Summation (optional) == | |||
Summarizing variants and effects of SNPs. | Summarizing variants and effects of SNPs. | ||
* Reference genome must be in SNPEff, need GFF3 file of your genome annotation | * Reference genome must be in SNPEff, need GFF3 file of your genome annotation | ||
* SNPEff looks at heterozygous and homozygous SNPs, MNPs | * True for most genomes (even Vaccinia WR, now) | ||
* SNPEff looks at heterozygous and homozygous SNPs, MNPs, lots coverage, indel sizes, etc.. | |||
=== Running SNPEff === | === Running SNPEff === | ||
* Select SNP:Effect -> SNPEff near the bottom of the tool menu | |||
[[File:SNPEff.jpg]] | [[File:SNPEff.jpg]] | ||
* Run on any pileup file | |||
=== Results from SNPEff === | === Results from SNPEff === | ||
* Only as good as your genome annotation file | * Only as good as your genome annotation file | ||
* Introns in viruses? | * Introns in viruses?! SNPEff has a loose interpretation of introns. | ||
* Too many results, better to filer the pileup file first | |||
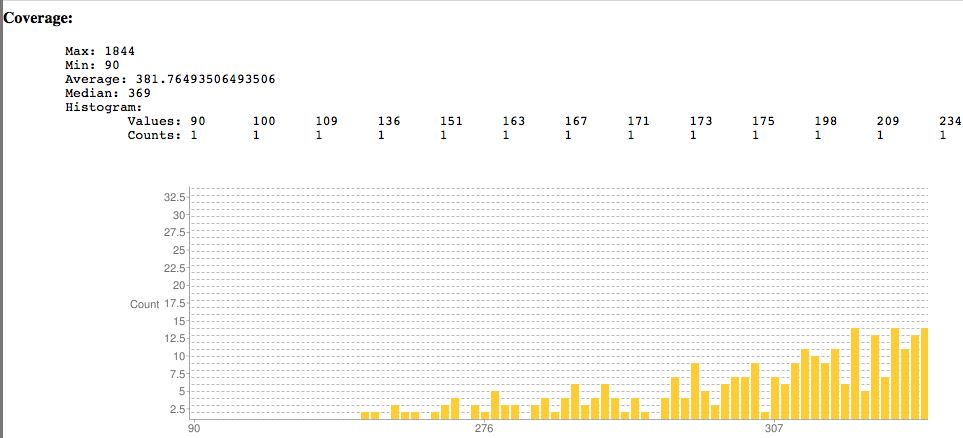
Sample SNPEff output showing coverage. Surprisingly the lowest read coverage is 90 here, others are much lower as is typical. | |||
[[File:SNPEffCoverage.jpg]] | [[File:SNPEffCoverage.jpg]] | ||
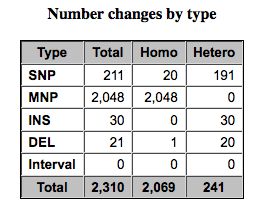
Pretty chart classifying SNPs. | |||
[[File:SNPEffResults.jpg]] | [[File:SNPEffResults.jpg]] | ||
== Finding the Relevant SNPs versus Control == | |||
Too many SNPs! We need to make some decisions as to what to include and exclude. This is an active area of research, answer depends on: | |||
* Overall coverage | |||
* Number of reads | |||
* Mapping quality | |||
* Base quality | |||
* Previous knowledge | |||
== Pileup Filter == | |||
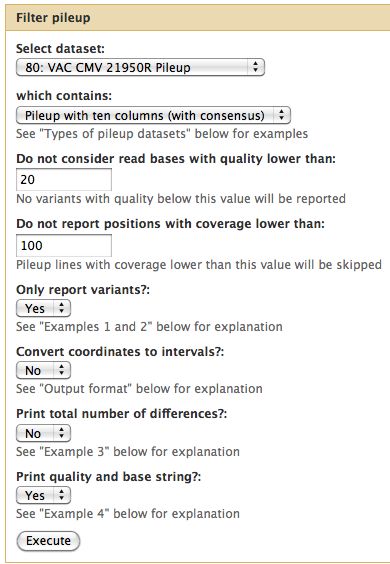
For the tutorial here, I selected a quality cutoff of 20 and a minimum coverage of 100 reads. | |||
* Filter all 3 pileups | |||
[[File:PileupFiltering100Reads.jpg]] | |||
If this runs but gives an empty result, it may be because Galaxy believes the pileup files are in tabular format. Fix this. | |||
== Difference from consensus == | |||
Now take only changes which result in a change from the consensus. | |||
* Select Filter and Sort -> Filter | |||
[[File:FilterRunVacWR.jpg]] | [[File:FilterRunVacWR.jpg]] | ||
[[File: | == Comparative Genomics == | ||
To review, the VAC-WR strain is the progenitor (parent) of the other two strains. It does not have a phenotype of interest. Thus we are only interested in genomic differences between our two mutants strains and the parent strain. Differences between the reference NCBI strain are not of interest if they also appear in the parent strain. | |||
* Since our data is in tabular format we can run Join, Subtract and Group -> Compare Two Datasets | |||
* Parameters are below | |||
* I assume changes at the same site are identical between parent and child | |||
[[File:CMV21950RvsVACWR CompareData.jpg]] | |||
=== Result File === | |||
* Tabular files great for dumping into Excel | |||
* Includes whether mutation is non-synonymous, its gene identifier, etc.. | |||
The left portion of the results file is shown below. | |||
[[File:SNPEffResultTabular.jpg]] | |||
=== SNP Effect Again (optional === | |||
Return SNPEff on the smaller dataset | |||
== Viewing results in IGV == | == Viewing results in IGV == | ||
* My preferred NextGen browser | |||
* Problems can be discovered, good reality check | |||
== De novo assembly == | |||
* Not covered here | |||
* Velvet on Galaxy, but not functioning properly (yet) | |||
Latest revision as of 14:19, 16 September 2011
Galaxy DNA-Seq Tutorial
Presentation PDF or original PPTX from HPC Boot Camp 2011.
Linking to data
Link in the Mark Pritchard Vaccinia virus data set.
- Start with a blank history, there should be no numbered items on the right hand side of the pane. Otherwise create a new history.
- Select "Shared Data" from the top of the screen to bring up the Shared Data screen
- Select Data Library
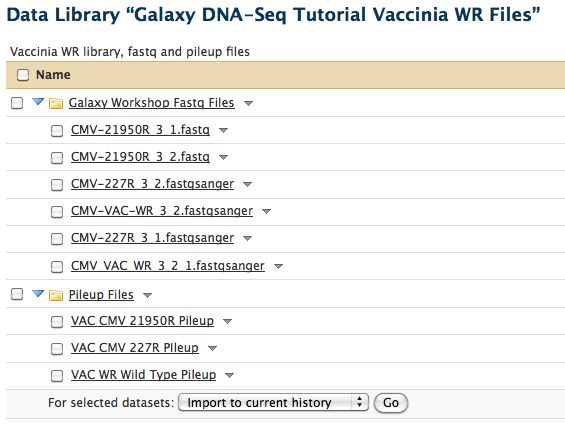
- Select "Galaxy DNA-Seq Tutorial Vaccinia WR Files" from the alphabetically sorted list
- Click on the subfolder top box to select all 6 files
- Select "import to current history"
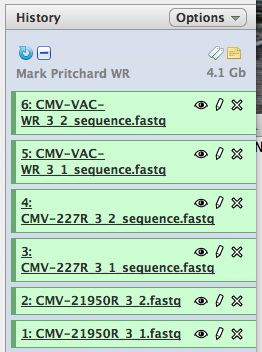
- Click on "Analyze Data" from the upper main menu. It should bring up the main page and your history pane should now look like the image below.
- Notice that with just 3 viruses are already over 4 GB of data!
Metadata - Formatting and Grooming Data
- Your data is often NOT what you expect so it is worth running some quality control programs
FastQ Format
- FastQ format can mean many things, see the wikipedia entry on FastQ format
- Ilumina FastQ format also not informative, it changes
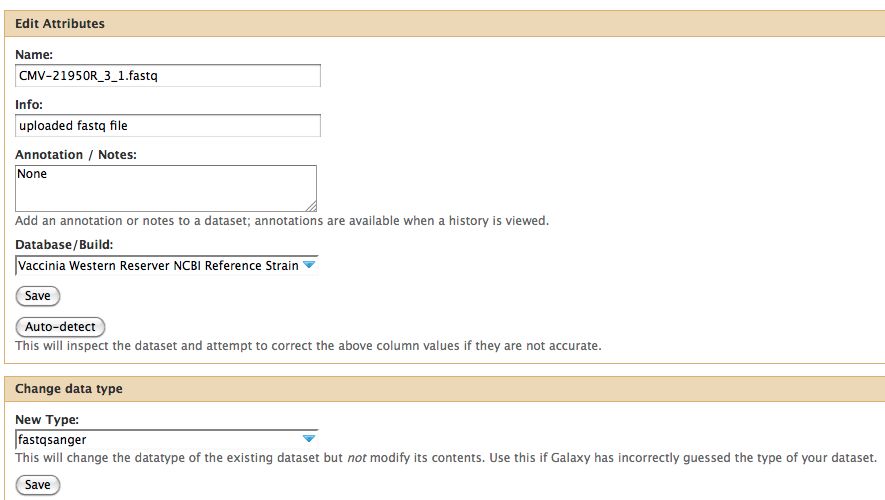
- Click on the pencil to icon in one of the virus images to pull up the attributes, your screen should look a bit like this:
- In Galaxy the expected data type of the galaxy tool must match EXACTLY with the data type in your history pane, otherwise the option to use that particular piece of data will not appear in the tool's drop down menu for data selection.
- Some tools care more than others...
- Galaxy requires that everything go into Sanger format to be used. If you know your data is in sanger format, select fastqsanger for your data type. If it is not in that format, select fastq and run the FastQ Groomer.
- FastQ groomer is very useful, but slow
- Not a bad idea to run it if you are dealing with a new machine and have the time. Costly in terms of space.
- All files for the workshop have been pre-groomed so you don't need to do any grooming.
Reference Genome
- Ensure the correct reference genome is selected. WARNING - seeing the reference genome doesn't mean it is there for using - the current list of genomes available at UAB is here
- Contact the UAB Galaxy team or me (ozborn@uab.edu) if you need a genome added
- The reference genome is used for a variety of tools, some tools care more than others.
Notice any problems with CMV-21950R_3_1.fastq ? The meta-data is wrong, fix it before proceeding.
Assessing the quality of the data
We will use a number of different tools from the "NGS: QC and manipulation" drop down menu. Try processing the FastQ files with:
- FastQC
- Compute Quality Statistics
Running FastQC
FastQC gives an attractive visual output and will flag potential problems.
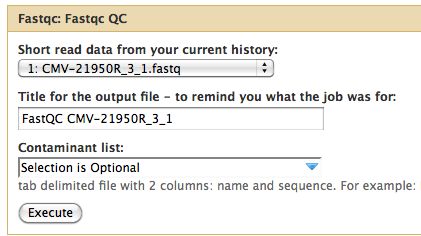
- Select NGS: QC and manipulation -> FastQC
- Run it on all the 6 fastq files
- Remember, you are on a cluster, this can be done in parallel!
FastQC Results
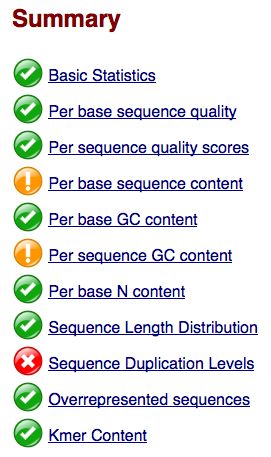
Take a look at the other areas that show up as quality issues.
- FastQC flags potential problems
- Are there any problems for us?
- Remember earlier comments about poxvirus genome architecture..
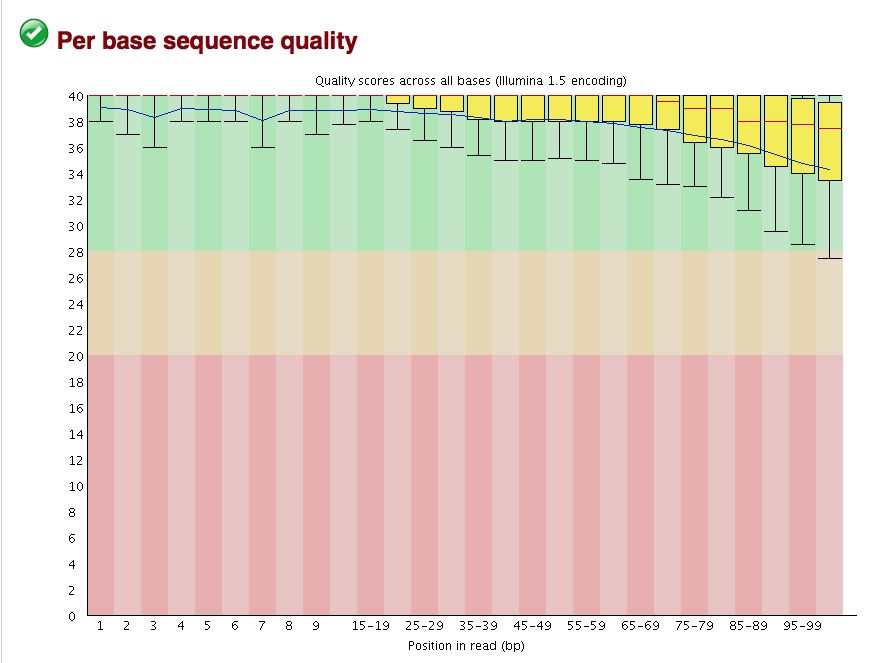
The overall quality of the bases is excellent, but sometimes binning can hide some ugliness.
- Base quality looks good, but breakdown is not on a per base basis
Running Quality Statistics and Boxplot
- Galaxy has its own set of tools for computing quality statistics (using R)
- Generates raw statistics in tabular format which can then be used for a pretty box plot
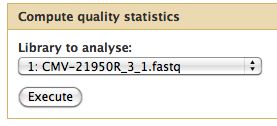
- Select NGS: QC and manipulation -> Compute Quality Statistics for CMV-21950R_3_1.fastq
- Run it to compute the tabular file
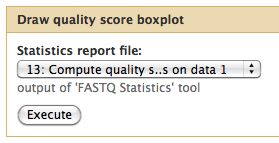
- Why wait? Jobs can be queued, so go ahead and queue up a box and whiskers plot
- "NGS: QC and manipulation" -> Draw Quality Score Boxplot
- Can run it on "Data 13" (or whatever) even if Data 13 doesn't exist yet / isn't ready
Quality Statistics and Boxplot Results
- Should have a tabbed result file that is easy to manipulate in Galaxy
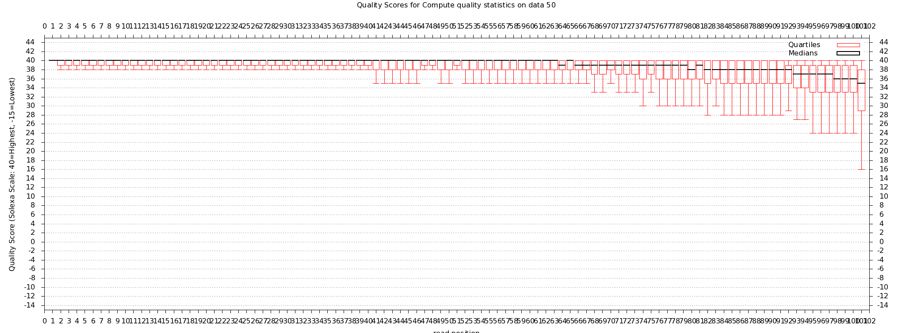
- Should get a nice box and whiskers plot
- Problems with this data? How does it compare to FastQ?
Trimming Reads
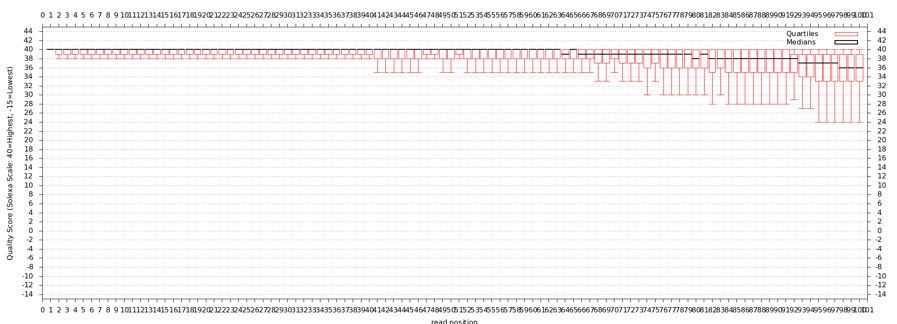
- About a quarter of the last base is of poor quality
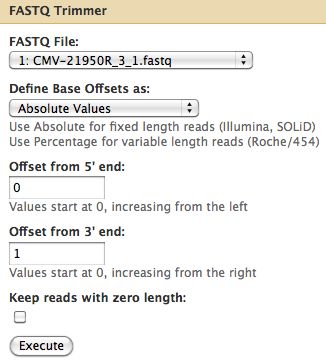
- Trim off the 3' end off Cmv21950R_3_1
- Select NGS: QC and manipulation -> FASTQ Trimmer by column which is under Generic Fastq Manipulation
- There are other ways to clean up, reads can be filtered by other criteria
- What to keep and what to throw away depends on your requirements
Results
- Take the trimmed data and run again compute quality statistics and draw the boxplot as was done earlier
- Results should look like above if everything was done correctly
- May want to rename your trimmed result file to something more useful like "Cmv21950r 3 1 trimmed" or something. Just click on the current name to rename the data.
Short read alignment to reference genome using BWA
- BWA will align all the short reads to our reference genome
- BWA is the algorithm of choice for DNA-Seq with Illumina data
- CASAVA 1.8 may do as well for SNPs, BWA does indels better
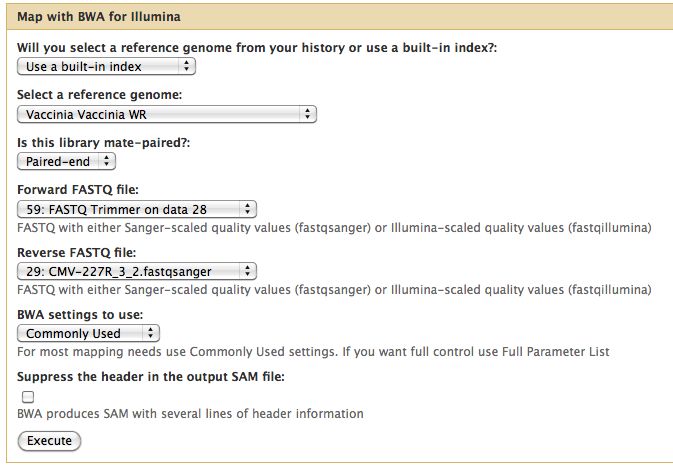
- Select NGS Mapping -> Map with BWA for Illumina
- Set the reference genome as Vaccinia Western Reserve, BWA doesn't pick this up
- Selected paired reads, make sure the first read (1) comes first
- Do this for all 3 genomes, each run will use 2 fastq files
Samtools
- Essential toolset, performs a variety of functions
- Format conversion
- Viewing BAM files
- Flagstats
- Generation of Pileup
BAM Conversion
- The output of many mapping programs (including BWA) is in SAM format and must in many cases be converted to the binary format (BAM) format for downstream analysis
- The conversion is lossless.
- As a binary file, it is significantly smaller than the SAM file
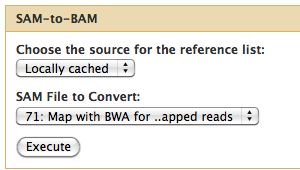
- Convert all 3 SAM files to BAM
- In this case we did not do any filtering on the SAM file prior to conversion to BAM
- Often when quality is desired, a filtering step will be done to remove reads which:
- Fail quality control
- Are optical duplicates
- Are not properly paired
Additionally a sorting step may be done, important if you are going to examine the BAM file in a browser like IGV
- See Shared Data -> Published Workflows -> "FastQ to High Quality, Filtered, Headered, Sorted BAM" or
- Click on this workflow
Flagstat
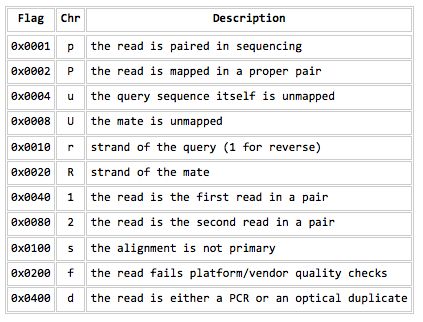
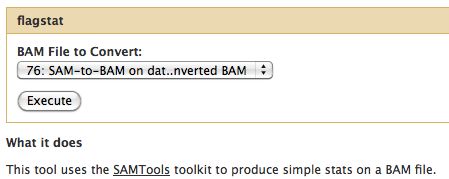
- Examines the flag integer in the BAM File
Generate Pileup
- Should have 3 BAM files
- Can think of the reads "piling up" on each other
- Each base pair location on the genome is assigned a representative base
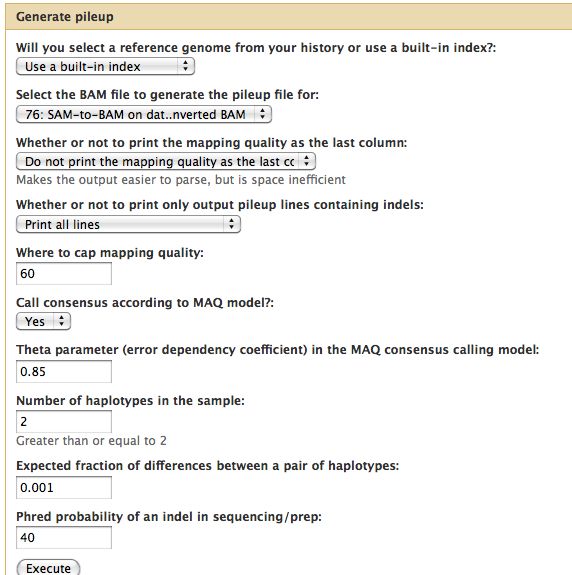
- For each of the 3 BAM files, run NGS: SAM Tools -> Generate Pileup
You should get pileups with ~150kb of reads. Unfortunately, probably because the MAC consensus model was selected Galaxy assigns the output format as tabular instead of pileup. This will cause a problem when filtering the pileups, so alter the metadata of the 3 files to "pileup" from tabular.
Alternatives to Samtools for Variant Detection
- GATK - Emerging as the new best practice to call variants, not integrated into Galaxy just yet.
- PATRIC - Whole genome annnotation (once you have a sequence) for microbial genomes
- MAQ and others - not used too much anymore
If you are having trouble getting to this stage, don't worry, correct pileup files for all 3 viruses are in the same shared data library
SNP Effect (SNPEff) - Variation Summation (optional)
Summarizing variants and effects of SNPs.
- Reference genome must be in SNPEff, need GFF3 file of your genome annotation
- True for most genomes (even Vaccinia WR, now)
- SNPEff looks at heterozygous and homozygous SNPs, MNPs, lots coverage, indel sizes, etc..
Running SNPEff
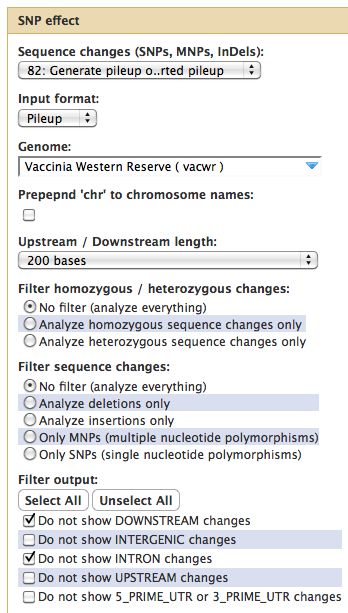
- Select SNP:Effect -> SNPEff near the bottom of the tool menu
- Run on any pileup file
Results from SNPEff
- Only as good as your genome annotation file
- Introns in viruses?! SNPEff has a loose interpretation of introns.
- Too many results, better to filer the pileup file first
Sample SNPEff output showing coverage. Surprisingly the lowest read coverage is 90 here, others are much lower as is typical.
Pretty chart classifying SNPs.
Finding the Relevant SNPs versus Control
Too many SNPs! We need to make some decisions as to what to include and exclude. This is an active area of research, answer depends on:
- Overall coverage
- Number of reads
- Mapping quality
- Base quality
- Previous knowledge
Pileup Filter
For the tutorial here, I selected a quality cutoff of 20 and a minimum coverage of 100 reads.
- Filter all 3 pileups
If this runs but gives an empty result, it may be because Galaxy believes the pileup files are in tabular format. Fix this.
Difference from consensus
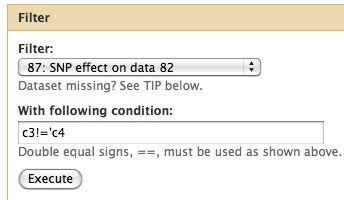
Now take only changes which result in a change from the consensus.
- Select Filter and Sort -> Filter
Comparative Genomics
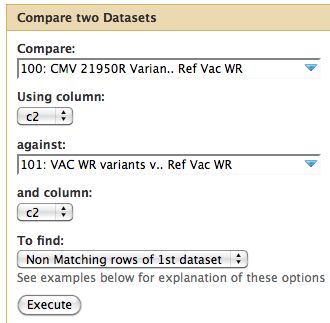
To review, the VAC-WR strain is the progenitor (parent) of the other two strains. It does not have a phenotype of interest. Thus we are only interested in genomic differences between our two mutants strains and the parent strain. Differences between the reference NCBI strain are not of interest if they also appear in the parent strain.
- Since our data is in tabular format we can run Join, Subtract and Group -> Compare Two Datasets
- Parameters are below
- I assume changes at the same site are identical between parent and child
Result File
- Tabular files great for dumping into Excel
- Includes whether mutation is non-synonymous, its gene identifier, etc..
The left portion of the results file is shown below.

SNP Effect Again (optional
Return SNPEff on the smaller dataset
Viewing results in IGV
- My preferred NextGen browser
- Problems can be discovered, good reality check
De novo assembly
- Not covered here
- Velvet on Galaxy, but not functioning properly (yet)
