Talk:NAMD Benchmarks
The efficiency of a parallel system describes the fraction of the time that is being used by the processors for a given computation. It is defined as
        Execution time using one processor       ts
E(n)= --------------------------------------  = ----
      N * Execution time using N processors     N tn
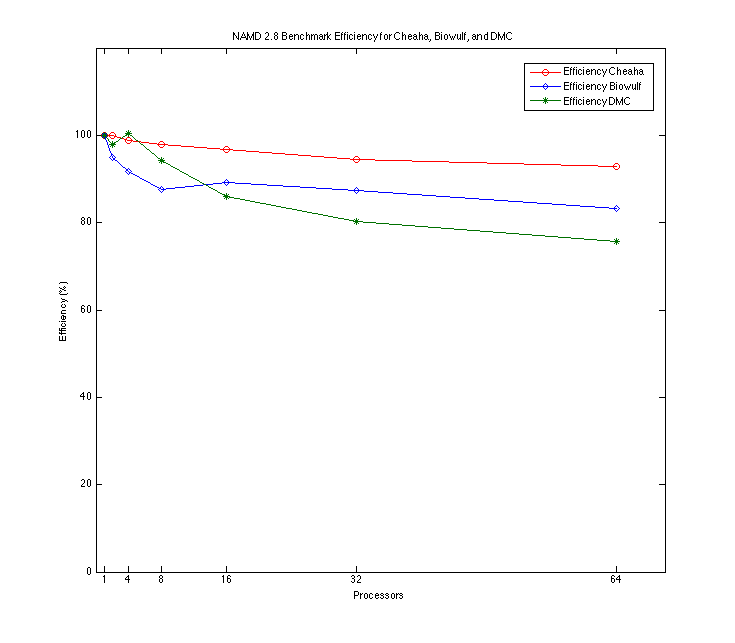
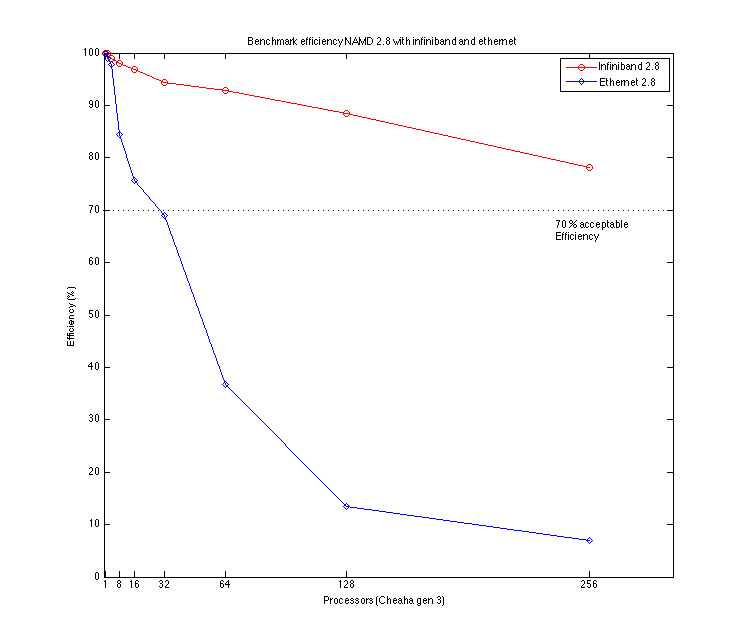
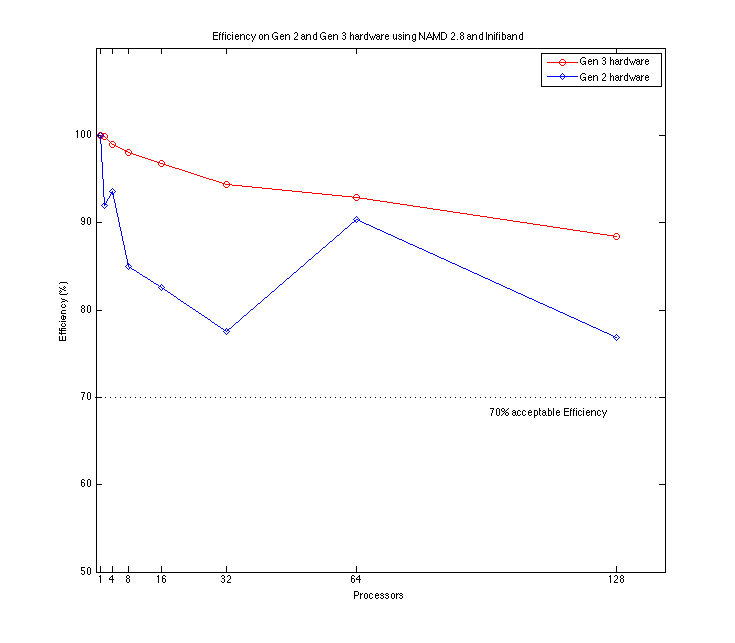
In general, parallel jobs should scale to at least 70% efficiency. The ASC's DMC recommends a scaling efficiency of 75% or greater. For NAMD the efficiency of a parallel job can be calculated as follows (where N is processors committed to the job):
  days/ns where N = 1
 --------------------- * 100 = Efficiency
      N * days/ns
Information on NAMD performance Scaling is available at: http://www.ks.uiuc.edu/Research/namd/wiki/?NamdPerformanceTuning
Benchmark used for performance evaluation on the Cheaha, Biowulf, and DMC is Apoa1 from the NAMD suite and is available at: http://www.ks.uiuc.edu/Research/namd/utilities/
The parameters for the benchmark used through out are: 500 steps, 92K atoms, 12A cutoff + PME every 4 steps.
Sample Benchmark using NAMD
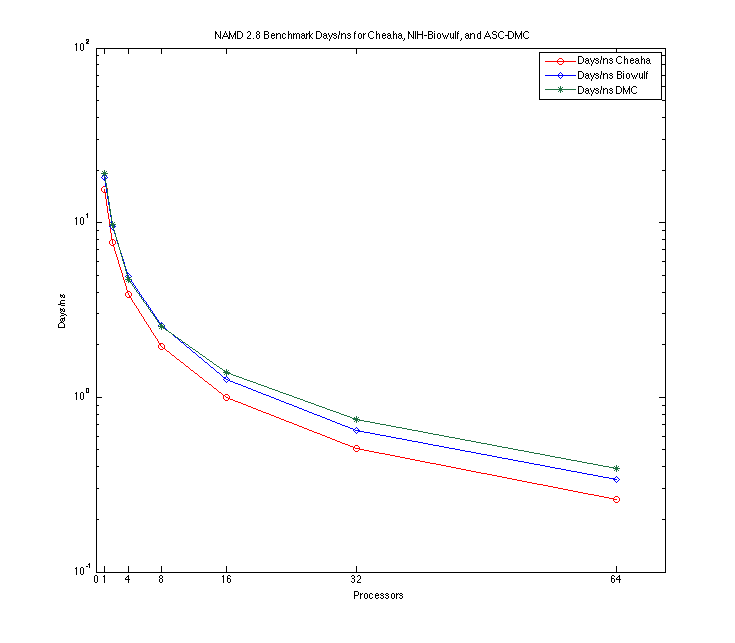
Sample Benchmark comparing Days/ns for Cheaha, Biowulf, and DMC using InfiniBand
| Processors | Cheaha | Biowulf | DMC <ref group="note" >No hardware control was possible for the ASC's DMC and as such it is possible that different runs might have run on different hardware. *Efficiency on DMC using 4 processors is above 100%. This could be probably because of an older generation processor being used to run the job serially i.e. using 1 processor, thus setting a lower baseline to begin with causing the efficiency to go up as better processors are available for the parallel jobs.</ref> |
|---|---|---|---|
| 1 | 15.4054 (100%) | 18.0535 (100%) | 19.1000 (100%) |
| 2 | 7.7119 (99.87%) | 9.5163 (94.86%) | 9.7600 (97.84%) |
| 4 | 3.8933 (98.92%) | 4.9222 (91.69%) | 4.7570 (100.3%)* |
| 8 | 1.9653 (97.98%) | 2.5763 (87.59%) | 2.5360 (94.14%) |
| 16 | 0.9950 (96.76%) | 1.2658 (89.14%) | 1.3870 (86.06%) |
| 32 | 0.5101 (94.37%) | 0.6463 (87.29%) | 0.7438 (80.24%) |
| 64 | 0.2592 (92.83%) | 0.3390 (83.22%) | 0.3938 (75.78%) |
| 128 | 0.1360 (88.45%) | NA | NA |
| 256 | 0.0770 (78.09%) | NA | NA |
| 512 | 0.0439 (68.49%) | NA | NA |
Bench mark notes
The above benchmarks were run using NAMD 2.8b1 and the Apoa1 benchmark suite from NAMD.
On Cheaha, only the third generation hardware was used for the above benchmarks. More information about the hardware used on Cheaha is available here.
The data for the NIH-Biowulf benchmarks is available at: http://biowulf.nih.gov/apps/namd/namd_bench.html. The Biowulf hardware used for comparison in the e2800 with Infiniband.
- ASC-DMC
<references group="note"/>
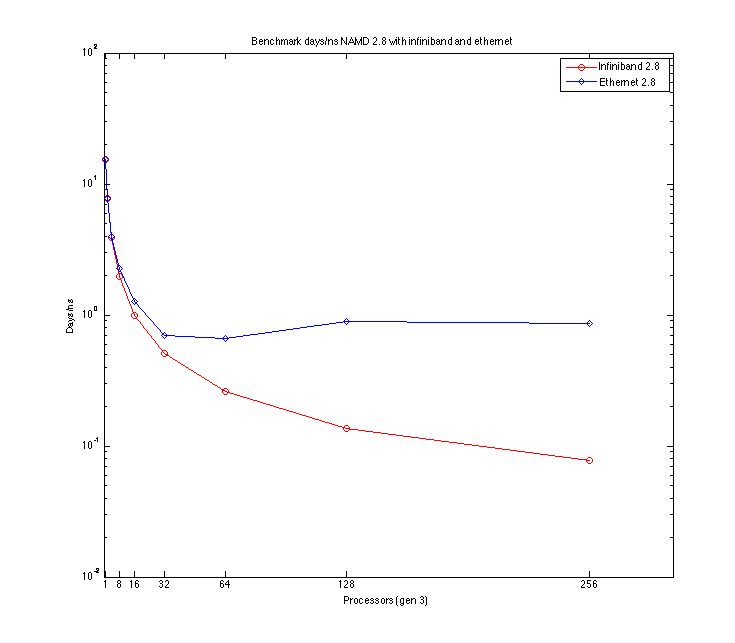
Comparison of Ethernet and IB
| Processors | Infiniband | Ethernet |
|---|---|---|
| 1 | 15.4054 (100%) | 15.4040 (100%) |
| 2 | 7.7119 (99.87%) | 7.7800 (98.99%) |
| 4 | 3.8933 (98.92%) | 3.9405 (97.72%) |
| 8 | 1.9653 (97.98%) | 2.2816 (84.39%) |
| 16 | 0.9950 (96.76%) | 1.2714 (75.74%) |
| 32 | 0.5101 (94.37%) | 0.6973 (69.03%) |
| 64 | 0.2592 (92.83%) | 0.6562 (36.67%) |
| 128 | 0.1360 (88.45%) | 0.8950 (13.44%) |
| 256 | 0.0770 (78.09%) | 0.8632 (6.97%) |
| 512 | 0.0439 (68.49%) | NA |
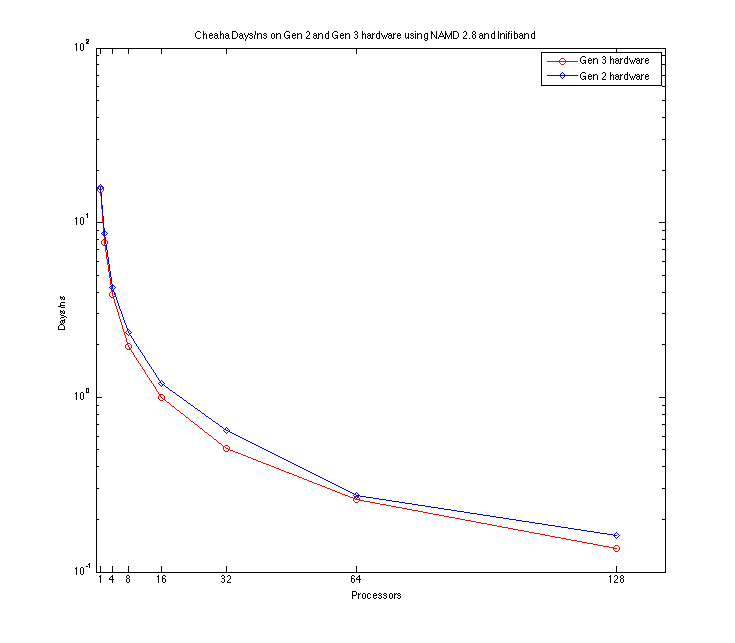
Comparison on different Generations of Cheaha hardware on NAMD with Infinband
| Processors | Generation 3 | Generation 2 |
|---|---|---|
| 1 | 15.4054 (100%) | 15.9300 (100%) |
| 2 | 7.7119 (99.87%) | 8.6620 (91.98%) |
| 4 | 3.8933 (98.92%) | 4.2560 (93.59%) |
| 8 | 1.9653 (97.98%) | 2.3450 (84.93%) |
| 16 | 0.9950 (96.76%) | 1.2060 (82.56%) |
| 32 | 0.5101 (94.37%) | 0.6420 (77.57%) |
| 64 | 0.2592 (92.83%) | 0.2750 (90.38%) |
| 128 | 0.1360 (88.45%) | 0.1620 (76.81%) |
| 256 | 0.0770 (78.09%) | NA |
| 512 | 0.0439 (68.49%) | NA |
Hardware Notes
Generation 3 hardware contains 576 cores. 2.66 GHz Intel Xeon Hex-core (48-2x6 core) Generation 2 hardware contains 192 cores. 3.06 GHz Intel Xeon Quad-core (24-2x4 core) More information about the hardware used on Cheaha is available here.
