Gromacs Benchmark: Difference between revisions
No edit summary |
No edit summary |
||
| Line 100: | Line 100: | ||
==Other Benchmarks == | ==Other Benchmarks == | ||
These benchmarks have been performed by Mike Hanby at | These benchmarks have been performed by Mike Hanby at Research Computing after 2007 Hardware upgrade to the Cheaha. | ||
=== 2007 Hardware and Gromacs 3.x === | === 2007 Hardware and Gromacs 3.x === | ||
Revision as of 18:01, 14 June 2011
This page is under construction!
The efficiency of a parallel system describes the fraction of the time that is being used by the processors for a given computation. It is defined as
        Execution time using one processor       ts
E(n)= --------------------------------------  = ----
      N * Execution time using N processors     N tn
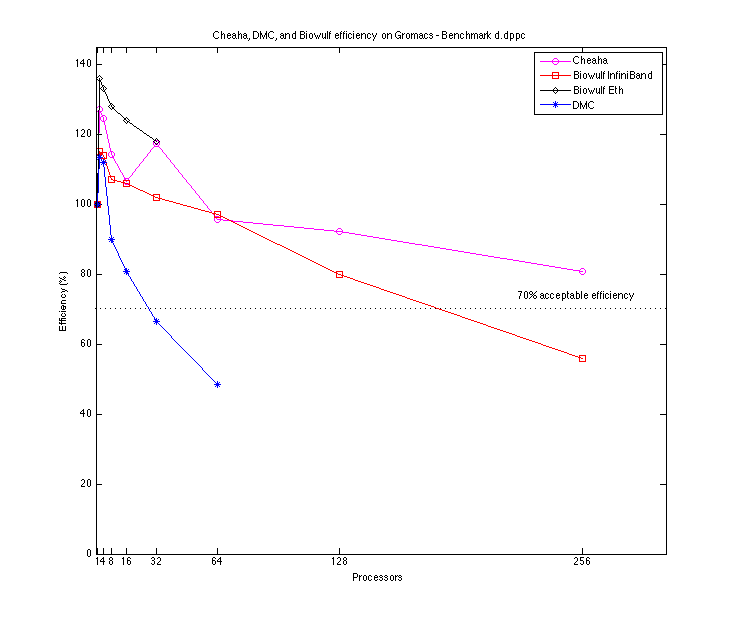
In general, parallel jobs should scale to at least 70% efficiency. The ASC's DMC recommends a scaling efficiency of 75% or greater. For Gromacs the efficiency of a parallel job can be calculated with either the Wall clock parameter or the ns/day parameter. We use the wall clock and efficiency is calculated as (where N is processors committed to the job):
        Wall Clock where N = 1
 ------------------------------------- * 100 = Efficiency
      N * Wall Clock on N processors
Benchmark used for performance evaluation on Cheaha, Biowulf, and DMCis the d.dppc which is available from the Gromacs benchmark suite and is available at: http://www.gromacs.org/About_Gromacs/Benchmarks
Information on how to submit Gromacs jobs to Cheaha is available here.
Sample Benchmark using Gromacs
Benchmark parameters: 1024 DPPC lipids with 23 water molecules per lipid, totalling to 121856 atoms. A twin-range group based cut-off is used, 1.8 nm for electrostatics and 1.0 nm for Lennard-Jones interactions. The long-range contribution to electrostatics is updated every 10 steps. 5000 steps = 10ps.
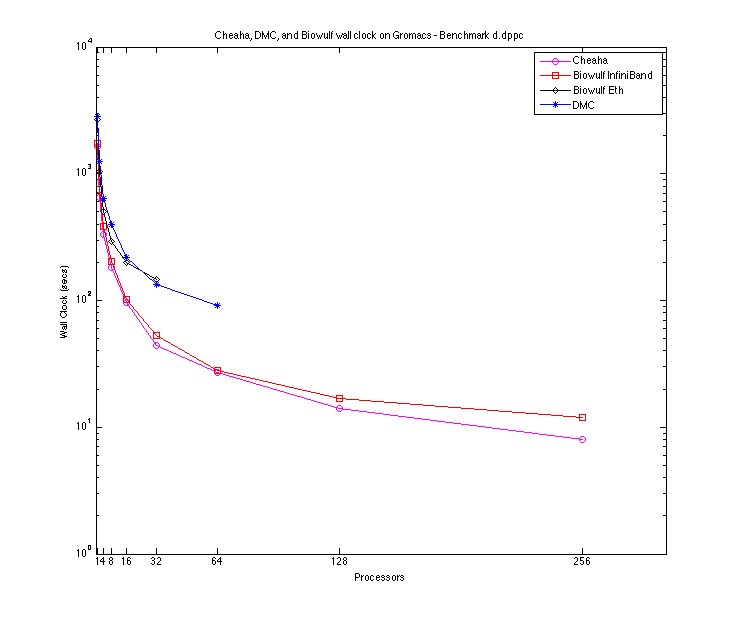
Cheaha, DMC, and Biowulf wall clock and efficiency on Gromacs - Benchmark d.dppc
| Processors | Cheaha | DMC | Biowulf IB | Biowulf Ethernet |
|---|---|---|---|---|
| 1 | 1562 (100%) | 2848 (100%) | 1734 (100%) | 2656 (100%) |
| 2 | 650 (127%) | 1256 (113%) | 754 (115%) | 1039 (128%) |
| 4 | 332 (124%) | 636 (112%) | 382 (114%) | 508 (131%) |
| 8 | 181 (114%) | 396 (90%) | 203 (107%) | 294 (113%) |
| 16 | 97 (106%) | 220 (81%) | 102 (106%) | 200 (83%) |
| 32 | 44 (117%) | 134 (66%) | 53 (102 %) | 147 (56%) |
| 64 | 27 (96%) | 92 (49%) | 28 (97%) | NA |
| 128 | 14 (92 %) | NA | 17 (80%) | NA |
| 256 | 8 (81%) | NA | 12 (56%) | NA |
Bench mark notes
The above benchmarks were run using d.dppc benchmark [1] from Gromacs.
On Cheaha, the second and third generation hardware was used for the above benchmarks. More information about the hardware used on Cheaha is available here.
The data for the NIH-Biowulf benchmarks is available at: http://biowulf.nih.gov/apps/gromacs/bench-4.0.3.html. The Biowulf hardware used for comparison in the e2800 with Infiniband and o2800 with ethernet.
Other Benchmarks
These benchmarks have been performed by Mike Hanby at Research Computing after 2007 Hardware upgrade to the Cheaha.
2007 Hardware and Gromacs 3.x
Note: The Gromacs 3.x code base was severely limited in spanning multiple compute nodes. The limit for 1GigE network fabrics was 4 nodes. The following performance data is provided for historical reference only and does not reflect performance of the Gromacs 4.x code base currently install on Cheaha.
Two identical 4 CPU Gromacs runs and the jobs spread out as follows based on current queue load (the new nodes are using Infiniband, the old TCP for message passing):
Dell Blades: 4 cpu job running on 4 compute nodes
Job ID:    71566
Submitted: 14:11:40
Completed: 17:06:03
Wall Clock: 02:54:23
              NODE (s)   Real (s)      (%)
      Time:  10462.000  10462.000    100.0
                      2h54:22
              (Mnbf/s)   (GFlops)   (ns/day)  (hour/ns)
Performance:    238.044     16.164      4.129      5.812
Verari: 4 cpu job running on 2 compute nodes
Job ID:    71567
Submitted: 14:11:44
Completed: 23:13:01
Wall Clock: 09:01:17
              NODE (s)   Real (s)      (%)
      Time:  32473.000  32473.000    100.0
                      9h01:13
              (Mnbf/s)   (GFlops)   (ns/day)  (hour/ns)
Performance:     76.705      5.208      1.330     18.040

