Talk:NAMD Benchmarks: Difference between revisions
Jump to navigation
Jump to search
No edit summary |
No edit summary |
||
| Line 7: | Line 7: | ||
===Table=== | ===Table=== | ||
{| border="1" align="center" style="text-align:center;" | {| border="1" align="center" style="text-align:center;" | ||
|+ | |+ Days/ns (efficiency) on Cheaha, Biowulf, and DMC | ||
!Processors | !Processors | ||
!Days/ns Cheaha | !Days/ns Cheaha | ||
| Line 58: | Line 58: | ||
|NA | |NA | ||
|} | |} | ||
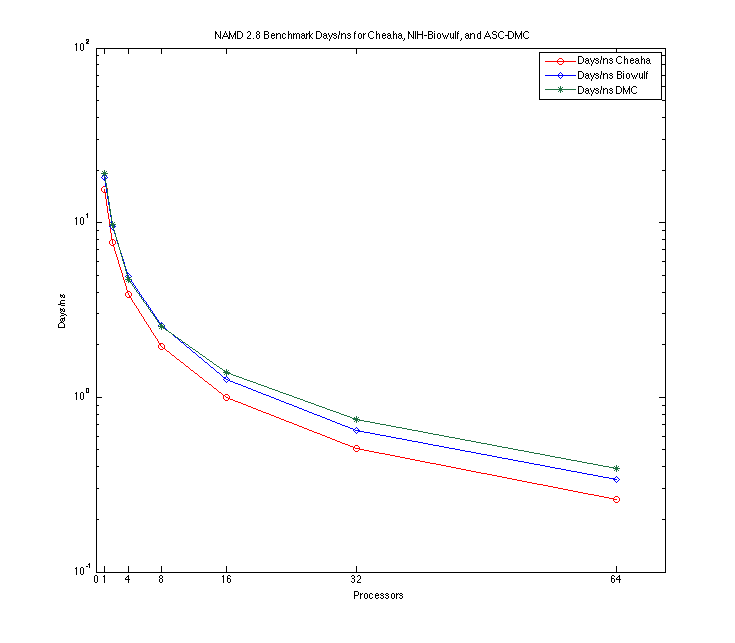
[[File:NAMD_benchmark_img1_Days_cheaha_dmc_biowulf.png]] | |||
===Graph's=== | ===Graph's=== | ||
Revision as of 13:43, 26 May 2011
Benchmark introduction Calculation of efficiency Scaling to higher processor count- Calculation for scaling
Sample Benchmark comparing Days/ns for Cheaha, Biowulf, and DMC using InfiniBand
Table
| Processors | Days/ns Cheaha | Days/ns Biowulf | Days/ns DMC |
|---|---|---|---|
| 1 | 15.4054 | 18.0535 | 19.1000 |
| 2 | 7.7119 | 9.5163 | 9.7600 |
| 4 | 3.8933 | 4.9222 | 4.7570 |
| 8 | 1.9653 | 2.5763 | 2.5360 |
| 16 | 0.9950 | 1.2658 | 1.3870 |
| 32 | 0.5101 | 0.6463 | 0.7438 |
| 64 | 0.2592 | 0.3390 | 0.3938 |
| 128 | 0.1360 | NA | NA |
| 256 | 0.0770 | NA | NA |
