Galaxy DNA-Seq Tutorial: Difference between revisions
Jump to navigation
Jump to search
(Adding pre-trim boxplot) |
|||
| Line 44: | Line 44: | ||
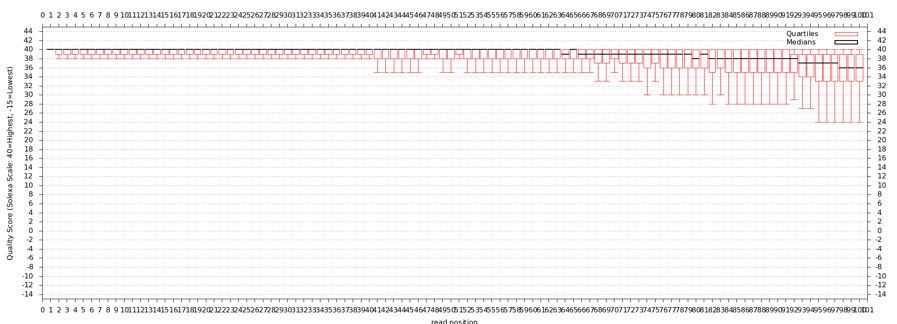
[[File:Cmv21950r 3 1 original boxplot.jpg]] | [[File:Cmv21950r 3 1 original boxplot.jpg]] | ||
[[File:Cmv21950r 3 1 trimmed boxplot.jpg]] | |||
== Short read alignment to reference genome using BWA == | == Short read alignment to reference genome using BWA == | ||
Revision as of 20:59, 14 September 2011
Galaxy DNA-Seq Tutorial
Linking to data
Link in the Mark Pritchard Vaccinia virus data set.
- Start with a blank history, there should be no numbered items on the right hand side of the pane. Otherwise create a new history.
- Select "Shared Data" from the top of the screen to bring up the Shared Data screen
- Select "Mark Pritchard Vaccinia WR" from the alphabetically sorted list
- Click the top box to select all 6 files
- Select "import to current history"
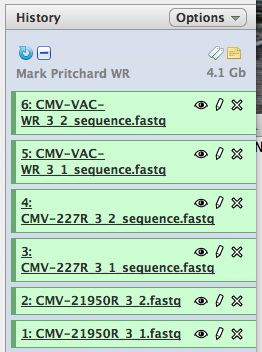
- Click on "Analyze Data" from the upper main menu. It should bring up the main page and your history pane should now look like the image below.
- Notice that with just 3 viruses are already over 4 GB of data.
Formatting and Grooming Data
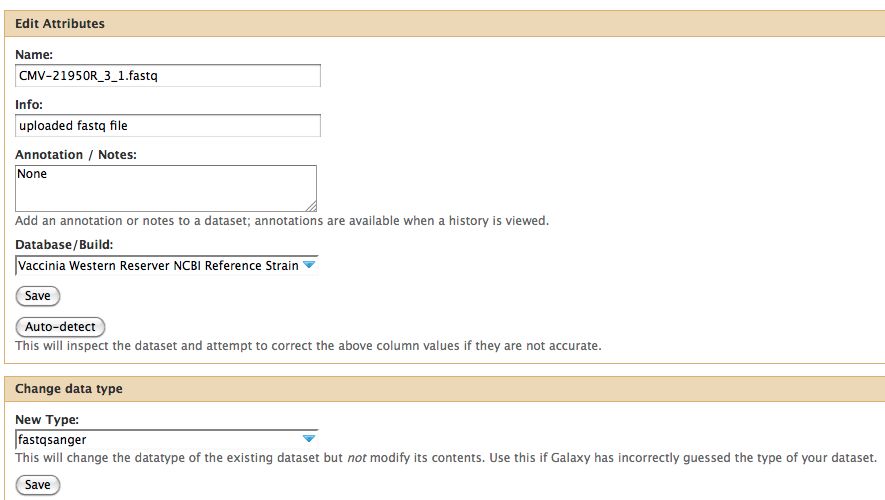
- Click on the pencil to icon in one of the virus images to pull up the attributes, your screen should look a bit like this:
- The important thing to notice is the data type. In Galaxy the expected data type of the galaxy tool must match EXACTLY with the data type in your history pane, otherwise the option to use that particular piece of data will not appear in the tool's drop down menu for data selection.
- There are multiple types of FastQ format, see the wikipedia article on FastQ for an idea. Galaxy requires that everything go into Sanger format to be used. If you know your data is in sanger format, select fastqsanger for your data type. If it is not in that format, select fastq and run the FastQ Groomer.
Assessing the quality of the data
We will use a number of different tools from the "NGS: QC and manipulation" drop down menu. Try processing the FastQ files with:
- FastQC
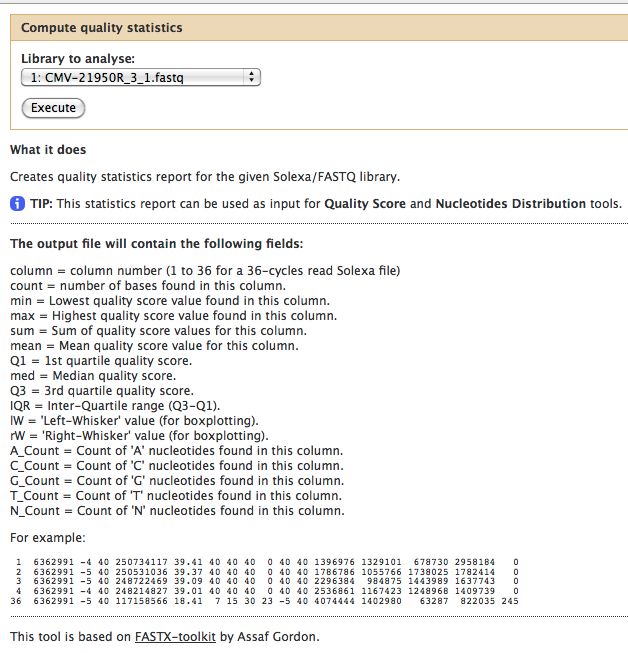
- Compute Quality Statistics
FastQC gives an attractive visual output and will flag potential problems.
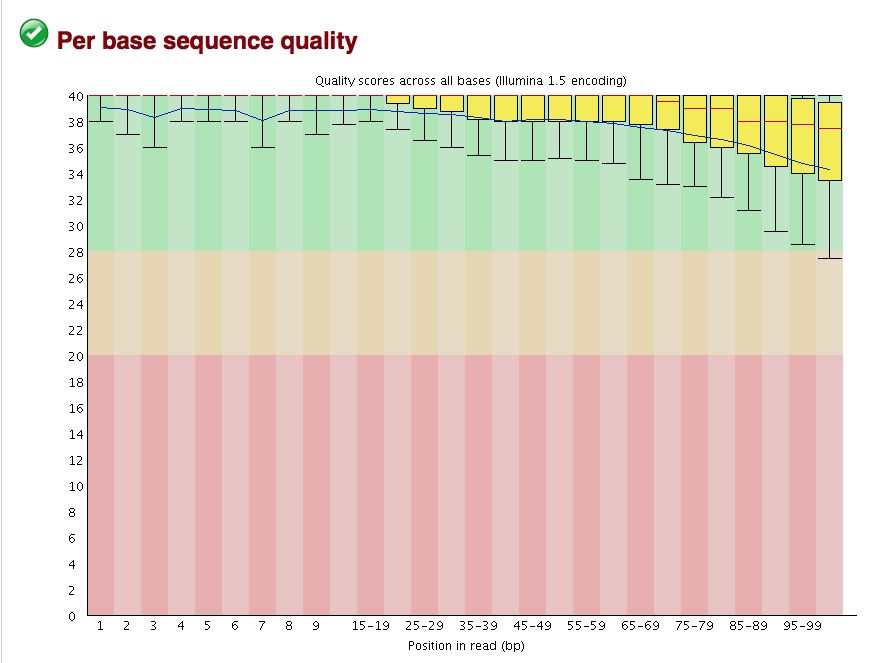
Take a look at the other areas that show up as quality issues. Can any of these be a problem for us?
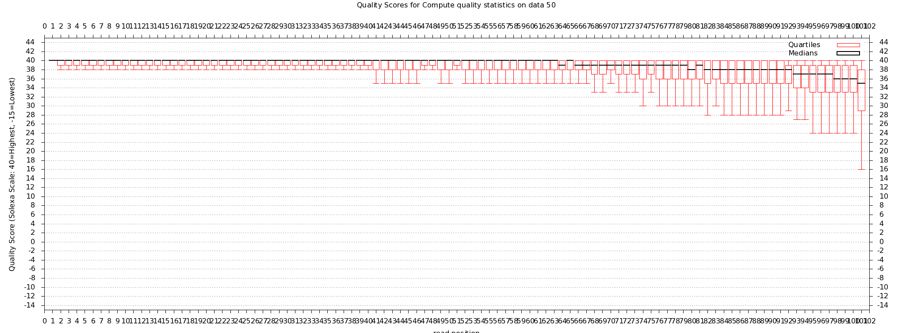
The quality statistics computing by the 2nd operation can be used for another box and whiskers plot to look at the read quality on a base by base basis. Select:
- "NGS: QC and manipulation" -> Draw Quality Score Boxplot
